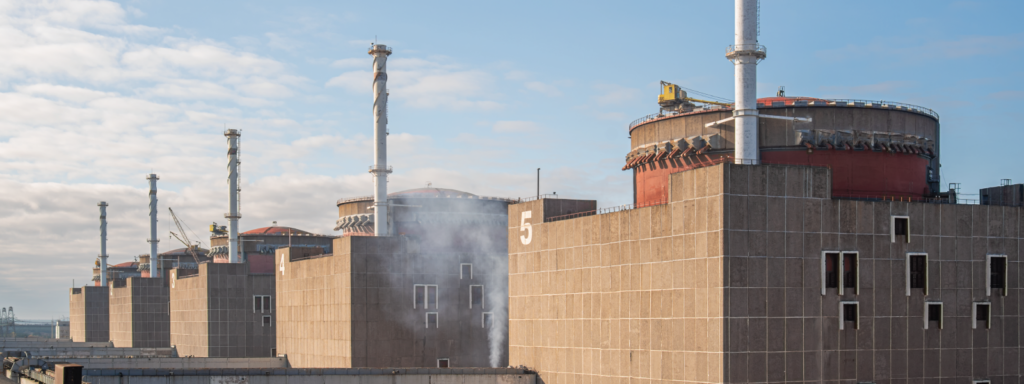
The Russian nuclear power company Rosatom took over operation of the Zaporizhzhia Nuclear Power Plant (ZNPP) in Ukraine on March 4th, 2022 [1]. Although Rosatom is operating the ZNPP, recent developments observed and reported by both international and US organizations suggest that there are certain scenarios that may lead to a potential large release of radioactive materials. For example, if Russia is pushed back by the Ukrainian forces in the region then Russia has to abandon the NPP. In that case, Russia may choose to deliberately do damage and cause a release. Another likely scenario is that, since the Russians have chosen the site as a military holding site, an attack from either side or an accident may cause a release.

The US Department of Energy’s National Nuclear Security Administration (NNSA) expressed concern over the developing situation in a statement issued on March 6, 2023. They stated, “From the outset of Russia’s full-scale invasion of Ukraine in 2022, disregard for the principles of nuclear safety and security has been a persistent feature of Russia’s misconduct. In particular, Russia has threatened the safe operation of Ukrainian nuclear power plants, raising the risk of a nuclear emergency whose effects would be felt far from the borders of Ukraine” [1].
In his statement on the situation in Ukraine following a serious safety incident in November 2022, International Atomic Energy Agency (IAEA) Director General Rafael Mariano Grossi warned, “The complete and simultaneous loss of off-site power for Ukraine’s nuclear power plants shows that the situation for nuclear safety and security in the country is [sic] become increasingly precarious, challenging and potentially dangerous.” He goes on to opine, “This would have been completely unimaginable before this tragic war. It is extremely concerning” [2].
For Dr. Hamza El-Asaad, a Stanton Nuclear Security Fellow at the Texas A&M Center for Nuclear Security Science and Policy Initiatives (NSSPI), evaluating the consequences of nuclear security threats–like the intentional sabotage or attack of a nuclear power plant–is the main focus of his research. He has spent years performing simulations of radioactive material release and dispersion due to potential sabotage events or nuclear accidents using a state-of-the-art computer code called WSPEEDI-DB developed by the Japan Atomic Energy Agency [3]. The simulations take into account real-life meteorological data and can be used by policymakers to plan for hypothetical attacks or incidents at a nuclear power plant. As a Stanton Fellow, he is working with faculty mentors NSSPI Director Dr. Sunil Chirayath, NSSPI Distinguished Faculty Fellow Dr. Siegfried Hecker, and Professor of Political Science Dr. Matthew Fuhrmann to anticipate the consequences of potential sabotage at nuclear power plants in the US.
When Dr. El-Asaad began to realize the enormity of the situation in the Ukrainian ZNPP, he decided to run a “what-if” scenario for the plant. He conducted a preliminary evaluation of the consequences due to a potential radiological material release at the ZNPP by performing simulations.
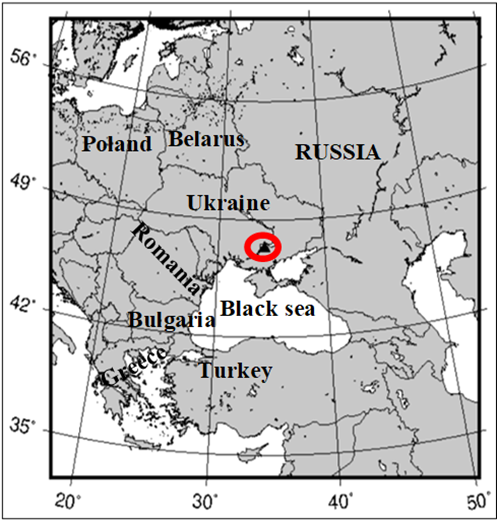
Figure 1 shows the region selected around the ZNPP for estimating the consequences from the potential release of radioactive materials. Dr. El-Asaad obtained the plume patterns from simulations made for four selected days for the potential sabotage event. The days selected corresponded to the two seasonal solstices and two equinoxes.

According to Dr. El-Asaad, plume patterns are very important to analyze because the shape and intensity indicated in the plume will determine how far, how fast, and how many countries will be affected by the transportation and deposition of radionuclides.
The study included dispersion of the prominent radionuclides, and the released fraction of each source term is shown in table 1. He used a released source term of similar magnitude to that of the Fukushima-Daiichi nuclear accident in 2011 in Japan. “The study considered the release fraction of the source term similar in magnitude as that of Fukushima to be on the conservative side even though the attack on ZNPP may not release such a large amount of radionuclides,” explained Dr. El-Asaad.
Another input used by the code to perform the simulations was the Weather Research Forecast data (WRF), consisting of wind speed and direction, regional terrain, atmospheric temperature, precipitation, etc. [4]. The release period for all the simulations was 48 hours.
Table 1. Released source term assumed for the simulations [5]
| Source term (Bq/release period of 48 hours) | ||||||||
| Xe133 | Cs134 | Cs137 | Sr90 | Te132 | I131 | I132 | I133 | I135 |
| 1.1E+19 | 1.8E+16 | 1.5E+16 | 1.4E+14 | 8.8E+16 | 1.6E+17 | 1.3E+13 | 4.2E+16 | 2.3E+15 |

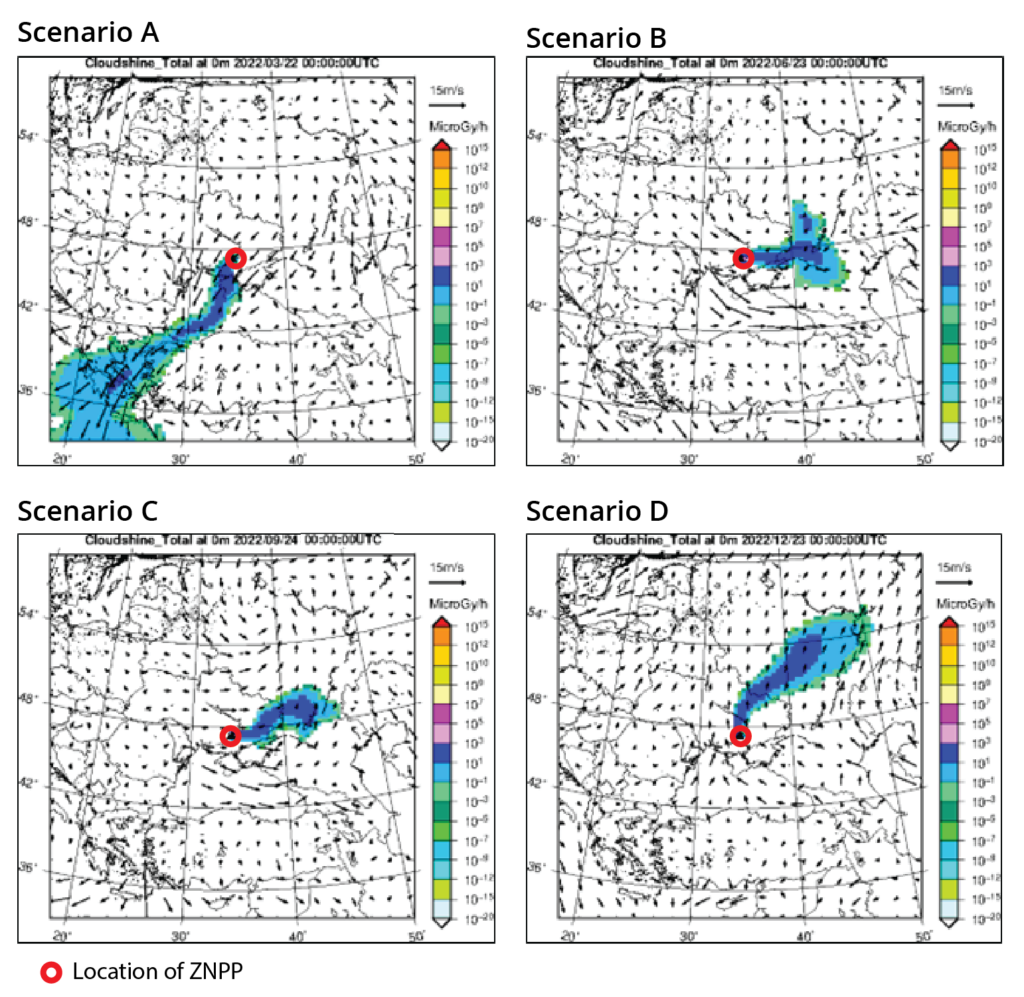
Figure 2 (a)-(d) shows the radioactive plume pattern for the four cases analyzed, and the location of the ZNPP, also called the “release point,” can be seen as a triangular shape. The simulation results on the radiation dose rate magnitude are depicted in figure 2 (a) – (d). The cloud shine plume shape shown in figure 2 is after 48 hours of dispersion from ZNPP with dates and time in UTC (Coordinated Universal Time).
The first scenario (a) takes place on the first day of spring, or the vernal equinox. In this scenario, Dr. El-Asaad describes, “The plume starts heading southwest but, as the plume stretches and becomes elongated, the winds in southern Europe show large wind vectors with over 20 km/h gusts. These gusts transport the plume to various countries in a short period of time.” In fact, according to his simulation, in the 48-hour dispersion, the plume is shown to have contaminated six countries (two of which are in North Africa but are not shown in the figure).
Table 2 describes the danger levels corresponding to the different colors in the figure, and table 3 describes the different plume patterns. For this scenario, the simulation has shown the plume to be elongated and spreading both horizontally and vertically, so this plume has been designated as a mix of no. 2, 3, and 4 (based on table 3) characteristic plume, which corresponds to B, B-to-C, and B-to-C, respectively.
Table 2. Danger levels of plume dispersions
| C | Heading towards large city with large populations |
| B | Heading towards farmland and smaller towns with small populations |
| A | Heading towards ocean and/or empty lands |
Table 3. Plume characteristics with numbering designation
| No. | Types/shapes of plume | Description | Danger level |
| 1 | Contained | Covers small area with slow spread | A-B |
| 2 | Stretched | Covers a thin but long area with moderate spreading | B |
| 3 | Spreading horizontally | Latitude spreading with moderate to high spreading | B-C |
| 4 | Spreading vertically | Longitude spreading with moderate to high spreading | B-C |
| 5 | Outlier | Unlikely shape with bombardment like spreading | A-C |
| 6 | Out to sea | Not affecting land | A |
In the simulation that takes place at the start of summer, the plume initially heads directly east, dispersing horizontally. After 24 hours of release the plume starts to spread vertically to the north and south hence characterizing this plume as no. 3, initially. It then changes shape after a 48 hour period to no. 4. “This plume has been transported to heavily populated areas; therefore, it would be considered a danger level corresponding to B-to-C,” explained Dr. El-Asaad.
The scenario for the start of autumn shows very similar characteristics to plume (b) and has also been designated as a mix of no. 3 and 4 with danger levels ranging from B-to-C. Figure 2 (d) shows the plume taking on an elongated shape vertically, designating it as a mix of no. 2 and 4 plume.
In the scenario that takes place at the start of winter, the plume initially goes in a straight line then shifts towards the east whilst continuing to move in a northerly direction. This plume has a danger level of B and B-to-C due to the mega city that crosses its path after the 48th hour of the release.
In this ongoing study, Dr. El-Asaad reports that he has been able to extrapolate a few important points. According to what he has seen in his simulations, he notes, “The wind vectors in the southeast of Europe keep showing strong gusts and winds with a whirlpool-like shape. With this type of wind pattern, if a plume were to be transported into that area it would cause large amounts of deposition in the affected area as a result of the lingering plume.” He also observed that plumes heading east and northeast show that the wind vectors transporting those plumes are not as strong (or lack strong guests) compared to the plumes heading south and southwest. Plumes heading east usually display a contained, or no. 1 characteristic, plume.
The radiation dose rates on the ground due to the plume dispersion and deposition ranged from 1 to 1000 micro-Gray per hour (µGy/h). The natural background radiation dose rate in Ukraine is approximately 0.4 µGy/h [6]. Moreover, the socio-economic impact such a large release of radioactive materials can cause in the public domain is of great concern [6].
From the results of this simulation using real-world meteorological data, Dr. El-Asaad concluded that the contamination from an attack on the Ukrainian NPP would affect a number of countries and, if timed correctly, could potentially allow Russia to escape the consequences of the plume. State actors have their own meteorological services that can easily forecast weather data up to seven days ahead of time. “The highly radioactive plume,” explained Dr. El-Asaad, “would likely cause public panic, health risks, and mass evacuations in the affected countries.”
Understanding the risks of potential sabotage to the ZNPP using tools like the simulations Dr. El-Asaad has performed can help local leaders better plan their emergency response to these significant events. Being able to accurately anticipate the movement of the contamination can inform evacuation orders and even quell public fears of mass contamination.
“The situation in Ukraine has made us all more aware of how real the possibility of a nuclear security event is in the context of an ongoing war,” said Dr. El-Asaad. “Arming governments and policy makers with tools to deal with these threats and their consequences is crucial.”
References:
[1] National Nuclear Security Administration, “Russia’s Disregard for Nuclear Safety and Security in Ukraine,” U.S. Department of Energy, 4 March 2023. [Online]. Available: https://www.energy.gov/nnsa/russias-disregard-nuclear-safety-and-security-ukraine. [Accessed 6 March 2023].
[2] International Atomic Energy Agency. (2022, November 24). Update 132 – IAEA director general statement on situation in Ukraine. IAEA. Retrieved March 30, 2023, from https://www.iaea.org/newscenter/pressreleases/update-132-iaea-director-general-statement-on-situation-in-ukraine
[3] Japan Atomic Energy Agency, “Quicker calculation of atmospheric dispersion of radioactive materials under various conditions —Calculation time reduced to 1/100 using newly-developed “WSPEEDI-DB”—,” 2020.
[4] National Center for Atmospheric Research, Weather Research & Forecasting Model (WRF). Retrieved March 30, 2023, from https://www.mmm.ucar.edu/models/wrf
[5] Nakajima, T., Ōhara Toshimasa, Uematsu, M., & Onda, Y. (2019). Environmental contamination from the Fukushima nuclear disaster dispersion, monitoring, mitigation and lessons learned. Cambridge University Press.
[6] Kutsak AV. The Modern State of Problem of Providing Radio Protection of Ukraine’s Population from Natural Release Sources (review of literature). Probl Radiac Med Radiobiol. 2018 Dec; 23:49-60. English, Ukrainian. doi: 10.33145/2304-8336-2018-23-49-60. PMID: 30582836.